The chart is visible only for data collected from the source file (see: the command Open) or peripherals (see: the command From device), under the condition that when collecting data from a tachograph the option of reading detailed data speed was active.
Tachograph memorizes speed-relating data only for the last 24 hours and with the frequency of one second.
|
|
By default the program shows a chart from the entire 24 hours of drive. By means of tools located above the chart it can be scaled, moved, printed, etc.
The tools include:
| • |  - enlarging the chart by 10%, - enlarging the chart by 10%, |
| • |  - decreasing the chart by 10%, - decreasing the chart by 10%, |
| • |  - enlarging given area, - enlarging given area, |
| • |  - activates moving of the chart, - activates moving of the chart, |
| • |  - automatically resets the chart dimensions into default ones in both axes, - automatically resets the chart dimensions into default ones in both axes, |
| • |  - automatically resets the chart dimensions into default ones in the horizontal axis, - automatically resets the chart dimensions into default ones in the horizontal axis, |
| • |  - automatically resets the chart dimensions into default ones in the vertical axis, - automatically resets the chart dimensions into default ones in the vertical axis, |
| • |  - allows to save the chart to a file with the "bmp", "png" or "jpg" extension, - allows to save the chart to a file with the "bmp", "png" or "jpg" extension, |
| • |  - opens a chart print preview window, - opens a chart print preview window, |
| • |  - moves the date back by one day, - moves the date back by one day, |
| • |  - the field of choosing a date of a day included in the range of read speeds, - the field of choosing a date of a day included in the range of read speeds, |
| • |  - moves the date forward by one day, - moves the date forward by one day, |
| • |  - If you enter the precise time (date and time) in this field, the program will center the chart around the time and will broaden the chart to 10-minute span. - If you enter the precise time (date and time) in this field, the program will center the chart around the time and will broaden the chart to 10-minute span.
(5 minutes before and 5 minutes after the entered time) |
|
|
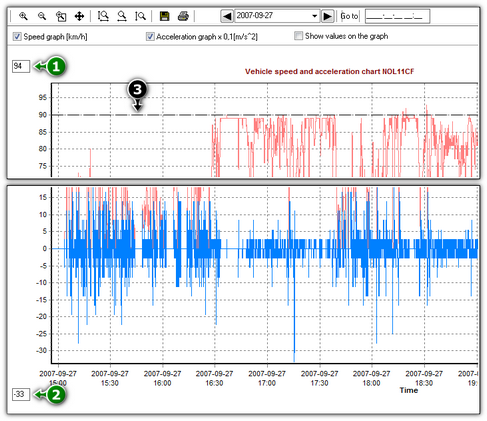
 | | Fig. The acceleration and speed chart window. |
Options description:
| • | Speed graph [km/h] - displays/hides the speed chart; |
| • | Acceleration graph x 0,1[m/s^2] - displays/hides the acceleration and deceleration graph; |
| • | Show values on the graph - displays/hides the speed or acceleration values directly on the chart - the option recommended for use with high zoom; |
| • | (Item 1 - Fig. above) - the upper speed limit - the chart will be displayed up to this value; |
| • | (Item 2) - the lower speed limit - the chart will be displayed from this value; |
| • | (Item 3) - dotted line - indicates the authorized speed. |
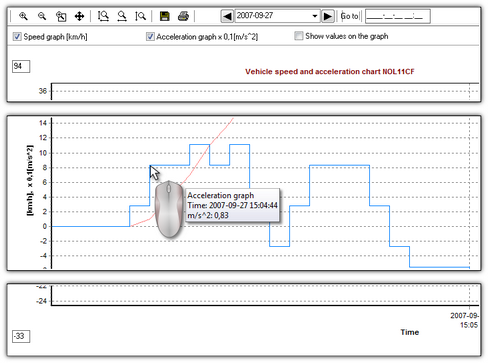
Fig. bellow shows two enlarged charts. You can precisely define acceleration or speed for a given point in the chart. In order to do so, point out the required position with the mouse – the program will display a box with the information pertaining to the position.
The possibility to preview the value in the required position by pointing it with mouse exists for both charts (speed and acceleration).
|
|
 | | Fig. Enlarged speed and acceleration charts. |
|
|
 - Allows to export the chart data to xlsx or csv file.
Pushing the button:  opens the window analysis of correctness of digital signatures.
See also:
Report preview window (printing and exporting)
![]() - Allows to export the chart data to xlsx or csv file.
- Allows to export the chart data to xlsx or csv file.![]() opens the window analysis of correctness of digital signatures.
opens the window analysis of correctness of digital signatures.