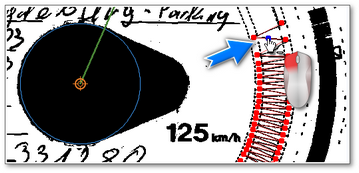
This tab contains a disk preview on which files indicating the number of kilometers passed by one driver are marked (red points). You can also set the start hour and correct the disk centre, if it has been indicated wrongly (moving the centre will cause re-reading of kilometers.
Kilometers chart
The main task of this tab is to show the results of interpretation of kilometres graph by the program. If the red line does not coincide with the black one drawn by the tachograph, re-scan the disc with other brightness settings or correct the position of points.
|
|
In the drop-down menu (right-click anywhere on the record sheet scan), there are two commands for automatic generation of km graph:
•Reanalyze record sheet - the program re-examines the record sheet scan and sets the km graph; •Add km peaks automatically - the program draws a km graph so that the sum of km read by the program from the scan was the same as the difference of km calculated from the starting and ending odometer reading - using this command is not recommended. |
|
Keep the button pressed:  (the cursor will become a "hand" with the sign "+") and click the place where the file is to be added (Fig. bellow). (the cursor will become a "hand" with the sign "+") and click the place where the file is to be added (Fig. bellow).
If the kilometers chart is well visible and, despite this, the program has not inserted files in some areas, it is recommended to set the disk’s centre first.
|
|
 Fig. Adding points manually. |
|
It is enough to click the unwanted file using the mouse left button (Fig. bellow). To delete all the points, click on the button:  . .
If the kilometers chart is well visible and, despite this, the program has not inserted files in some areas, it is recommended to set the disk’s centre first.
|
|
 Fig. Deleting points manually. |
|
|
|
Using the buttons  and and  you can enlarge or decrease the disk image so that information inserted there can be easily read from the computer’s screen. you can enlarge or decrease the disk image so that information inserted there can be easily read from the computer’s screen.
If the mouse is equipped with a ball, it will function as buttons mentioned hereinabove.
|
|
|
|
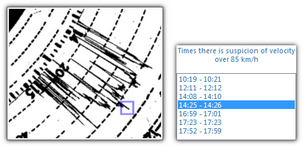
If an image size in the Settings is set as "Entire disk", the tab makes it possible to estimate whether a driver exceeded the maximum speed limit:
 Fig. Suspected exceeding of speed limit. If the speed chart clearly goes being the line showing 80km.h (and thus it can be suspected that the vehicle has reached forbidden speed limit) this moment will be shown on the list of hours and, as far as the chart is concerned, a blue rectangle will be shown (Fig. above).
|
|
The other buttons and options in the bottom toolbar are common to all tabs. Please see the description in the: Basic data section.
|
|


