selection
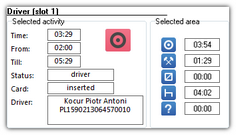
In the tab you can read information on the highlighted activities and the selected area. Depending on the chart in which the selection is made, the data appears respectively in the following windows:
•the first graph - Driver (slot 1);
•the second graph - Codriver (slot 2);
•the third graph - driver card.
In Driver (slot 1) and Codriver (slot 2) windows, driver card data is displayed (Fig. bellow), if on the given day, driver's actions were recorded on the driver card.

