Speed chart
The chart is visible only for data collected from the source file (see: the command [102] Open) or peripherals (see: the command From device), under the condition that when collecting data from a tachograph the option of reading detailed data speed was active.
Tachograph memorizes speed-relating data only for the last 24 hours and with the frequency of one second. |
|
By default the program shows a chart from the entire 24 hours of drive. By means of tools located above the chart it can be scaled, moved, printed, etc.
The tools include: • • • • • • • • • • • • • |
|
|
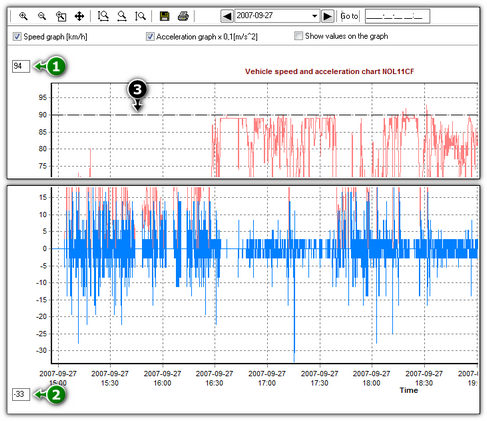
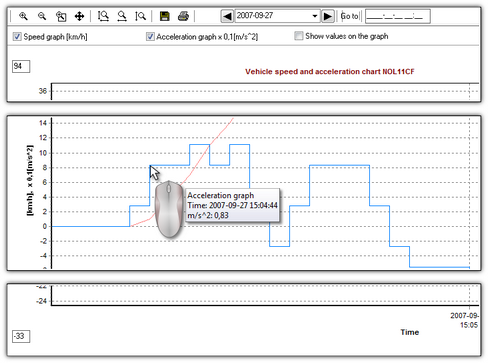
Options description: •Speed graph [km/h] - displays/hides the speed chart; •Acceleration graph x 0,1[m/s^2] - displays/hides the acceleration and deceleration graph; •Show values on the graph - displays/hides the speed or acceleration values directly on the chart - the option recommended for use with high zoom; •(Item 1 - Fig. above) - the upper speed limit - the chart will be displayed up to this value; •(Item 2) - the lower speed limit - the chart will be displayed from this value; •(Item 3) - dotted line - indicates the authorized speed. Fig. bellow shows two enlarged charts. You can precisely define acceleration or speed for a given point in the chart. In order to do so, point out the required position with the mouse – the program will display a box with the information pertaining to the position.
|
|
![]() - Allows to export the chart data to xlsx or csv file.
- Allows to export the chart data to xlsx or csv file.
Pushing the button: ![]() opens the window analysis of correctness of digital signatures.
opens the window analysis of correctness of digital signatures.
See also:
Report preview window (printing and exporting)


