Activities on a specific day
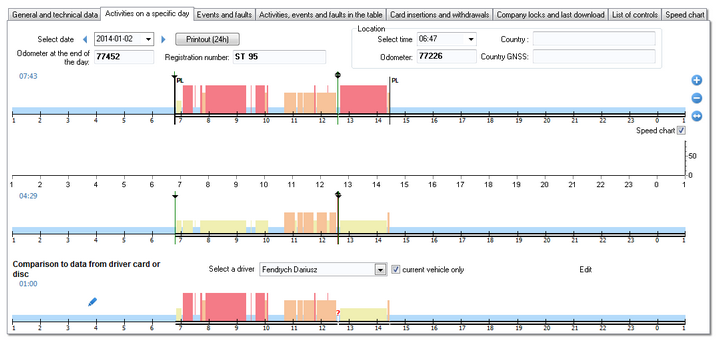
This tab contains a list of days that are saved in the tachograph for a given range of dates. Each day can contain the following data:
•date – using the buttons: ![]() and
and ![]() located next do the date we can change dates of collected days,
located next do the date we can change dates of collected days,
•button: ![]() - is for simulation of data printout by means of a digital tachograph (see: Print pictograms),
- is for simulation of data printout by means of a digital tachograph (see: Print pictograms),
•meter indication at the end of a day,
•vehicle’s registration number,
•places – this window shows "Odometer" and Country and GNSS country (filled in only if read from a smart tachograph).
➢![]() moves you to the OpenStreetMap map view with selected GNSS location points (only for smart tachograph reading);
moves you to the OpenStreetMap map view with selected GNSS location points (only for smart tachograph reading);
➢![]() displays GNSS data;
displays GNSS data;
➢ ![]() for vehicle location readings every 3 hours of cumulative drive time. Country and Odometer is left empty for such reading.
for vehicle location readings every 3 hours of cumulative drive time. Country and Odometer is left empty for such reading.
A digital tachograph saves meter indication only when a card is inserted or removed plus at 24:00 UTC time. |
|
Below the general data, there are three graphs:
|
|
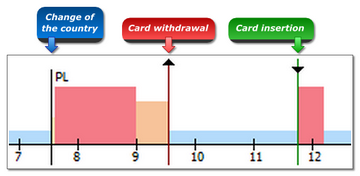
Similarly as for daily visualization of days from the driver card in the charts, you can:
•select action - in the Selection tab to read the data on it;
•select any area - in the Selection tab to read the information on the total duration of the activities in the area.
The first visualization is a daily graph of all events (especially driving events) recorded by the tachograph on slot no. 1, regardless of whether the driver card was inserted or not.
If, on a given day, the driver card was inserted into slot no. 1, the "Selection - Driver (slot 1)" tab shows the information about it. |
|
The second visualization, like the first one, is the graph of daily activities recorded on slot 2 (assistant), except that the tachograph in this slot does not record driving events. The main task of slot no. 2 is to record activity of the driver working in a team (team driving). If, on a given day, the driver card was inserted into slot no. 2, the "Selection - Codriver (slot 2)" window shows the information about it. |
|
The third visualization is the daily graph of data from the driver card or record sheet.
When you hover with the mouse on any event, the graph in the "Selection - Driver card" window shows the information on the event. If current vehicle only option is selected in the Select a driver field, the drivers who on this day drove the vehicle will be visible. However, if this option is unchecked, the Select a driver field will display all the drivers with records for that day. Use the |
|
|
|
Pushing the button: ![]() opens the window analysis of correctness of digital signatures.
opens the window analysis of correctness of digital signatures.
Other elements of the tab:
Table of Contents
|
|


