It is a graphical chart of driver activities during one week.
   - allow to zoom in and zoom out all daily charts or return to the default size. - allow to zoom in and zoom out all daily charts or return to the default size.
|
|
"Summary" tab
|
|
This field contains a summary of the individual activities shown on the graph:

|
- driving;
- work;
- availability;
- break;
- activities: card withdrawn.
|
|
|
Point with the mouse an activity on the chart and the respective information to this period of time appears on your right hand side as shown in the Fig. below.
For rests in which compensation occurs the date and the time of the compensated rest shall additionally appear in the frame.
|
|
 Fig. Point with the mouse to one of the driver activities on the chart |
|
A summary of various activities in the selected area is displayed in this field.
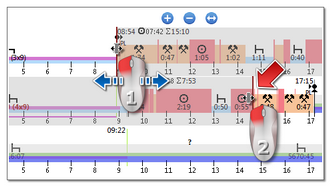
To select an area, click on the activities in the chart by selecting two lines (item 1 and 2 - Fig. bellow) marking the beginning and the end.
 Fig. Marking a part of the weekly chart.  Fig. Move selection line.
If the selection area is larger than the chart displayed on the screen while selecting, or have other problems, you can use when selecting an area from the dropdown menu.
Setting the start area - click the PPM to the desired location and drop-down menu, select "Set beginning";
Settings for the end of the area - click the PPM to the desired location and drop-down menu, select "Set end".
There is the option "bind the selection line to the events' edge" below the chart. When this option is activated the placed selection lines will be automatically moved exactly to the end/begin of the neighboring activity (item 2 - Fig. bellow).
|
|
|
|
|
|
"Days" Tab
|
|
The "Days" tab shows the sums of four basic events (driving, work, driver's availability, stop) for each day separately.
|
|
Visualization of infringements (for driver only)
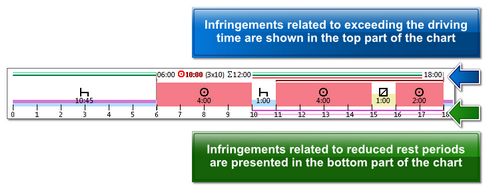
Beside the linear visualization of events, the chart shows also places in which offences occurred in connection with exceeding driving time or shortening resting time.
The weekly chart shows only authorized infringements.
A full description of the markings is available under the:  button. button.
|
|
|
|
 Fig. Place of displaying the infringements detected by the program. |
|
|
|
View/ Edit days from the driver card/ record sheet
|
|
From the weekly chart level it is possible to open the view/ edit the day from the driver card/record sheet (for a driver), or to open the day preview window from the digital tachograph (for a vehicle) - from the weekly chart drop-down menu, choose: Edit the day.
he program will open a preview window for the selected day in a new tab.
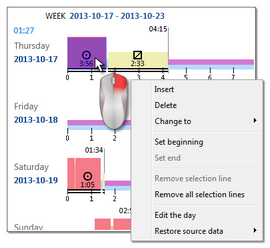
Directly on the weekly chart, it is possible to partially edit activities - event insert, replace and delete commands are available in the drop-down menu (Fig. bellow).
The commands list is active if the option: Edition blocked located below the chart is unchecked.
 Fig. Pull down menu of the weekly chart window.
In partial edition it is not possible to shift the boundaries of individual events.
If a change has been made in the weekly chart, left click the:  button in order to analyze offences again. button in order to analyze offences again.
|
|
|
|
|
|
Other buttons and markings
1. - "Driver's available working time". - "Driver's available working time". 2. - "Monthly chart". - "Monthly chart". 3. - Description of the markings on the chart. - Description of the markings on the chart. |
|
Special markings shown in the week chart (the same markings are also visible on the daily chart from the driver card):
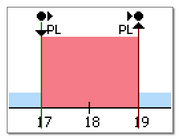
 Fig. Signs visible on the driver weekly chart.
Events: start/end, (inserting/removing the card, manual entry) are recorded on the driver card as the same type of event. Thus, a situation may occur in which there will be several consecutive inserts and removals of the card with change of location visible on the chart.
Detailed recording of the above events is performed by the tachograph itself. And in the program it is presented on the activity chart from the tachograph (see: "Digital tachograph data" - description: "Digital tachograph data preview window -> activities on a specific day, Activities, events and faults in the table or Card insertions and withdrawals").
|
|
|
|
|
|
Chart print out
There is an option of printing out the chart. After clicking LMB on:  button, a drop-down menu will be displayed, in which the following options are accessible: button, a drop-down menu will be displayed, in which the following options are accessible:
|
|
Displays print out preview of currently visible week.
|
|
Displays print out preview of currently marked weeks (see the above topic: "Selected activity").
|
|
Displays a print preview of the weeks included in the scope of control.
|
|
•Show legend on the printout - if this option is selected, the legend is displayed in the last page of the report; •Show activities list on the printout - when you select this option, below the weekly chart, right before the legend, a list of activity for the days included in the chart is displayed; •Colour - print in colour or in greyscale. |
|
|
|


